 Regina Cuervo, REALTOR®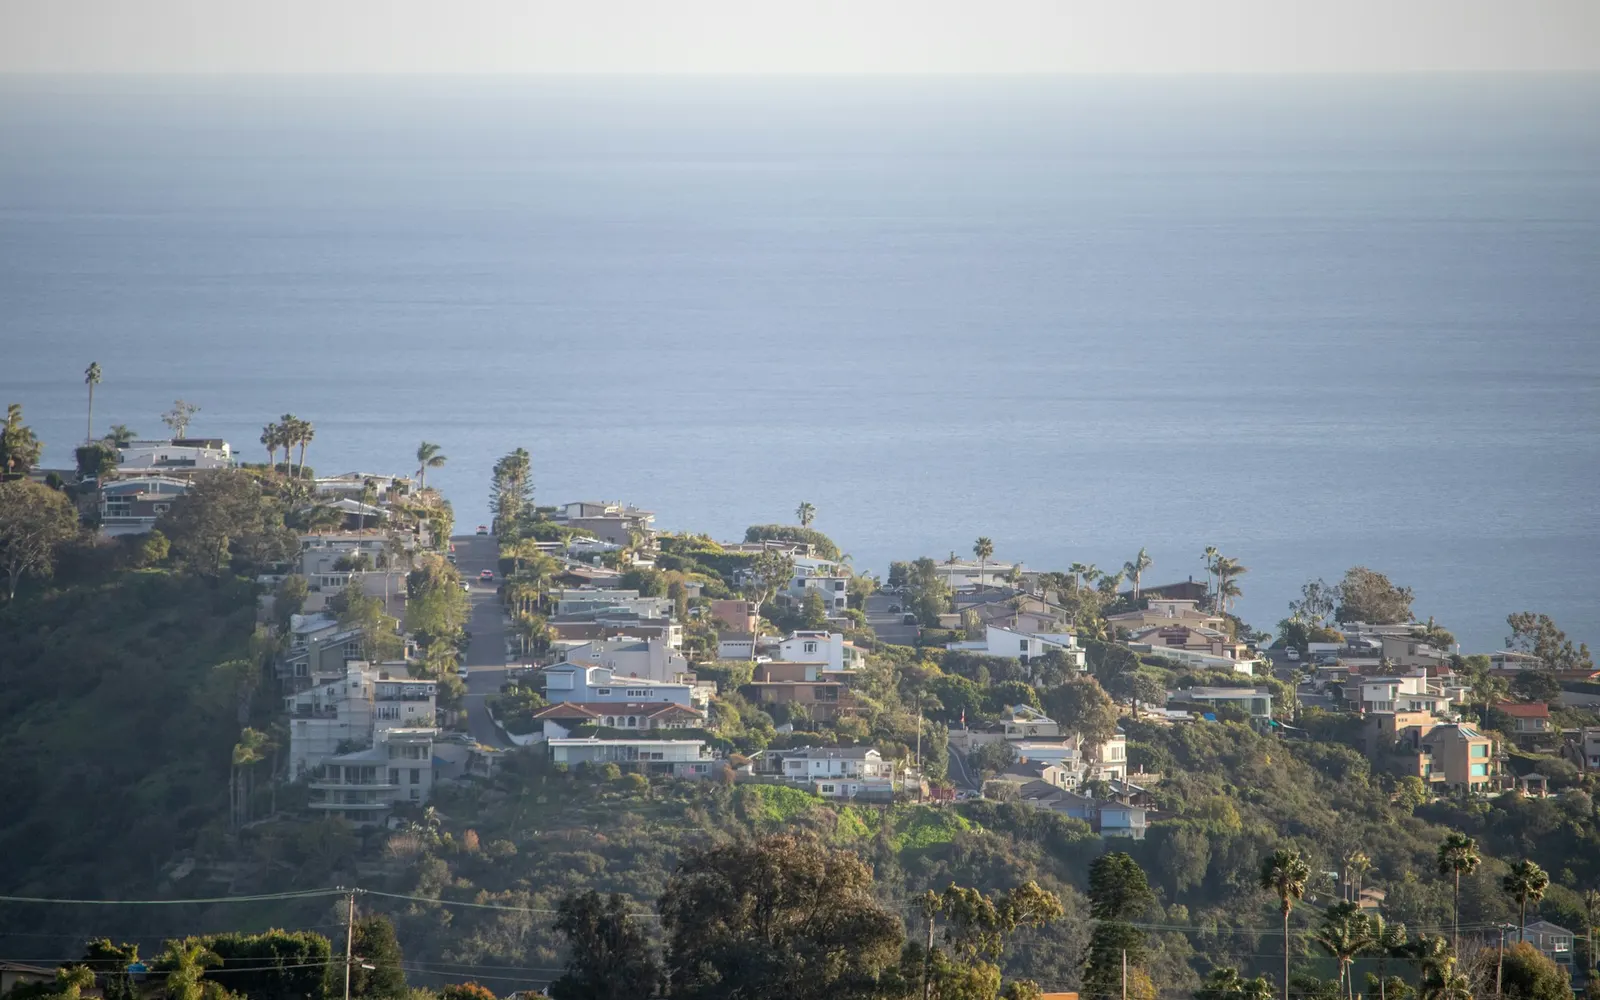
Orange County's $1,490,000 county median describes almost no actual neighborhood. In 2026 the county is running at two speeds: higher-priced coastal markets like Newport Beach and Irvine have cooled and offer buyers negotiating room, while more attainable inland cities see steadier demand. Always price against your submarket, never the county.
If you searched for Orange County home prices by city, you have probably already found a dozen pages with confident-looking tables of exact medians for every city. Here is something worth knowing before you trust any of them: those tables frequently mix incompatible numbers.
One row will be a median sold price. The next will be a median asking price. A third will be a Zillow home-value index, which is a modeled estimate rather than a transaction statistic. Put side by side in one table, they produce comparisons that look precise and are quietly meaningless.
So this guide does something different. It gives you the county-level figures I can source, explains the real structural split happening in 2026, and shows you how to get accurate city-level numbers yourself.
What is the actual median home price in Orange County?
The verifiable county-level figure: the median price for an existing single-family home in Orange County was $1,490,000 in June 2026, per the California Association of REALTORS®. That's up about 1.4% from $1,470,000 in June 2025, and essentially flat against May 2026's $1,492,000.
Separately, the median asking price on active single-family inventory was $1,849,000 as of the August 3, 2026 Orange County housing report.
Those two numbers describe different populations — one measures homes that sold, the other measures homes currently listed, which skew higher-priced and slower-moving. That distinction is exactly the one most city-by-city tables blur.
Why the county median describes almost nobody
A $1,490,000 median is the midpoint of an enormous distribution. Orange County contains, within a 40-minute drive:
- Attainable inland neighborhoods where first-time buyers are genuinely active
- Large master-planned communities with HOA and Mello-Roos structures that materially change monthly cost
- Established mid-county neighborhoods with 1960s and 1970s stock in every imaginable condition
- Coastal and ocean-view properties trading at multiples of the county median
No single number usefully describes all of that. Using the county median to price a specific home is like using the average temperature of California to decide what to wear in Newport Beach in January.
The 2026 split: coastal cooling, inland holding
The most important pattern in Orange County right now is not the level of prices — it's that the county has separated into two markets moving in different directions.
Higher-priced coastal markets have cooled. Reporting on 2026 market conditions describes year-over-year median declines in premium submarkets including Newport Beach and Irvine, with buyers gaining negotiating room. This is consistent with the countywide inventory picture: active listings rose to roughly 5,192 in early August 2026 while pending sales fell to 1,824 — the lowest pending count since March.
More attainable inland markets have held firmer, with reporting describing stronger relative demand in cities like Santa Ana and Anaheim.
That divergence makes intuitive sense once you connect it to financing. With the 30-year fixed at 6.69% (Freddie Mac, August 6, 2026), rate sensitivity scales with loan size. A half-point rate move on a $2.5 million purchase changes the monthly payment far more, in absolute dollars, than the same move on an $850,000 purchase. Higher-priced segments feel rate pressure first and hardest — which is precisely what the inventory data shows.
A necessary caveat: the coastal/inland characterization above comes from market commentary, not from a primary statistical release I can point you to for each city. I'm reporting the directional pattern because it's well-supported and consistent with the county data. I am deliberately not attaching false precision to it.
How to get accurate city-level prices
If you need a real number for a specific city, here is how to get one that means something.
1. Fix the metric before you compare anything. Decide whether you want median sold price, median price per square foot, or median list price — then use only that metric across every city. Price per square foot is often the most honest cross-city comparison because it partially normalizes for home size.
2. Filter to your property type. Countywide figures usually mean detached single-family homes. Condos and townhomes track differently. Comparing a condo to a single-family median will mislead you in both directions.
3. Use a tight time window. Ninety days of closed sales. Anything older is describing a different rate environment.
4. Narrow below the city. In Orange County, city boundaries are often the wrong unit. School attendance area, HOA boundary, and freeway proximity routinely matter more than which city name is on the mail. Two Irvine villages can differ substantially; a Costa Mesa home three blocks from the Newport line is not priced like the Costa Mesa median.
5. Check what's actively competing. Sold data tells you where the market has been. Active inventory tells you what a buyer can choose instead of your home right now.
What this means for buyers
Shop the submarket, not the county. If your budget sits near the county median, you are shopping in genuinely different competitive conditions depending on which side of the county you look at.
Coastal and higher-priced segments are where leverage currently sits. Rising inventory and falling pendings above roughly $1.5 million mean more days on market, more price reductions, and more sellers willing to discuss concessions and rate buydowns.
Attainable inland segments remain competitive. Don't assume the countywide "market is cooling" narrative applies to a well-priced home in a high-demand inland neighborhood. It frequently does not.
What this means for sellers
Your comps are your neighborhood's comps. A countywide median moving 1.4% tells you nothing actionable about your street.
Know which of the two markets you're in. If you're selling a higher-priced coastal property, you are competing against growing inventory and buyers who know they have options — pricing needs to reflect that from day one. If you're selling an attainable inland home, conditions are more favorable than the county headline implies.
The days-on-market spread is the warning. Countywide, the median home sold in 41 days while the average took 61. That gap is entirely made of mispriced listings sitting for months.
Frequently Asked Questions
What is the average home price in Orange County?
The median price for an existing single-family home in Orange County was $1,490,000 in June 2026, according to the California Association of REALTORS®. Median is generally more useful than average for housing, because a small number of very high-value sales pulls averages upward and misrepresents the typical transaction.
Which cities in Orange County are the most affordable?
Inland Orange County cities generally offer the most attainable prices, while coastal cities command the highest. Because published city-level figures often mix sold prices, asking prices, and modeled estimates, compare cities using a single consistent metric — median price per square foot over the last 90 days is usually the most honest basis.
Are Orange County home prices falling in 2026?
Countywide, no — the median was up about 1.4% year-over-year as of June 2026. But the county is running at two speeds: higher-priced coastal markets including Newport Beach and Irvine have cooled with reported year-over-year declines, while more attainable inland markets have held firmer.
Why is Newport Beach so much more expensive than Santa Ana?
Coastal proximity, ocean views, lot values, school attendance areas, and housing stock differ enormously across Orange County. These factors compound: a view lot in a top attendance area with newer construction carries several premiums at once, which is why prices within a single county can differ by multiples.
Should I compare cities or neighborhoods when buying in Orange County?
Neighborhoods. City boundaries frequently cut across school attendance areas, HOA boundaries, and freeway corridors that drive value more than the city name does. Two homes in the same city can differ substantially in value, while homes on either side of a city line can be nearly identical.
Where can I find reliable Orange County city-level price data?
Start with the California Association of REALTORS® for county-level sold data and your local MLS for city and neighborhood detail. Treat public portal estimates as ranges rather than figures. For a specific property or neighborhood, a REALTOR® can pull genuinely comparable closed sales filtered to your property type, condition, and school boundary.
Sources
- California Association of REALTORS® — home sales and price report (June 2026 Orange County median: $1,490,000)
- Orange County Housing Report (active inventory 5,192, pending 1,824, days on market, August 3, 2026)
- Freddie Mac Primary Mortgage Market Survey (30-year fixed at 6.69%, August 6, 2026)
Coastal-versus-inland directional characterizations are drawn from 2026 market commentary rather than a primary per-city statistical release, and are presented as pattern rather than precise measurement. For a specific property, request current comparable sales.